Our Journey to becoming Data Analysts: Project 6- It's not over, we've only just begun.
Success is the product of daily habit not a once-in-a-lifetime transformation -James Clear
So time flies they say, you never really know till you experience it. It's been 6 weeks but feels more like 6 months for us. We had time to bond, learn, unlearn, grow, laugh, cry and Analyze data together. It's hard to say it and harder to believe it but, this is officially our last project in the Side Hustle 5.0 Bootcamp.
The Task
The task this week was for us to derive insights from the analysis of the life expectancy of any selected country. As patriotic Nigerian citizens😇, we chose Nigeria. We got our dataset from Kaggle.com and began to work on it almost immediately.
Luckily, the dataset didn't require much cleaning and what we mainly needed to do was to filter out the country we were going to e conducting analysis on. After doing that we thought to ourselves, if this stage was pretty easy, the next stage was sure to be easier but, we were wrong, very very.
The Little Issue, we thought
As soon as we were done cleaning and filtering the data in Excel, we moved to Power Bi, where we would visualise the data. As soon as we transformed the data in Power Query, we began to stare blankly at the screen. We had no idea what to do next. Of course, this wasn't our first time visualising but this time, we were completely blank on the correct visuals to use or what the dashboard should contain, etc, Just blank. It felt strange, then we said okay maybe the meeting time is what is affecting our thinking but yet again, when we got on the meeting again, we were blank.
That's when we realized, it's not about how much you know all the time, but how much you are always willing to learn. Then again, we looked at it more closely and we began to understand how to go about it.
The visualisation was expected to display some certain visuals that would answer certain questions and we did our possible best to show them.

Some Insights From the Analysis
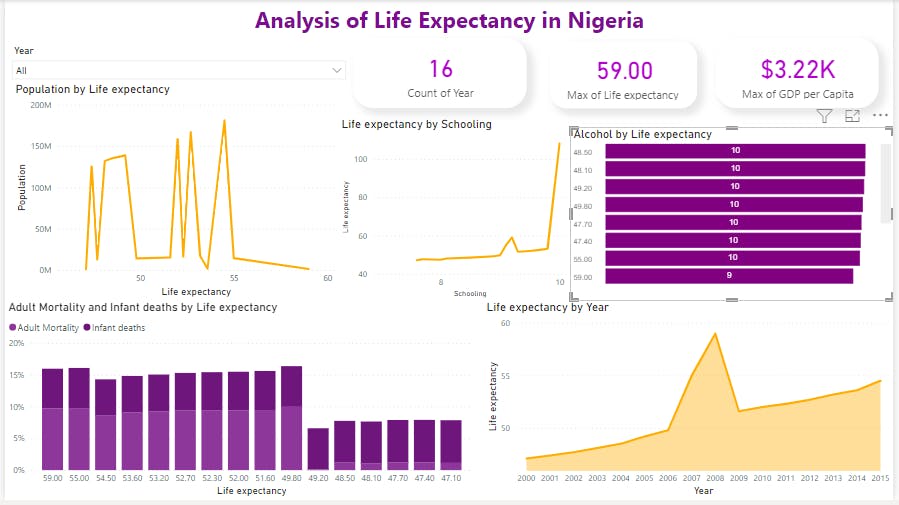
Life Expectancy was highest in 2008, being 59 years. Why? well after conducting some research, it was discovered that it was that same year that the Nigerian government conducted the Nigeria Demographic and Health Survey. It was an intensive survey that was well documented. from there we saw that, due to the increased amount of information they had as regards to the health of the population generally, they were able to take better actions towards curbing some major health issues.
When population was at it's highest, about 181 million people,the life expectancy was 54 years. This goes to say that the size of the population, although has a major influence, does not always stop the life expectancy from becoming better. what is really required is attention to expenditure on the health sector and what the resources being injected into the sector are utilised for.
The higher the life expectancy, the higher the adult mortality. It was seen that, when Life expectancy was progressively getting better, Adult mortality became greater than the number of infant deaths.
Finally
We begin by saying a very huge THANK YOU! to the organisers of the Bootcamp, you are the real MVPs. To everyone reading our blogs, thank you, your views and reviews have been much appreciated. It's been an awesome guide so far, we've had lots of fun and we've been frustrated many times but all in all, we've grown and we've had a taste of what it's like to be a Data Analyst.
Are we stopping here?? hell no! We are moving, and we are going to keep getting better in every way possible.
To the Newbies
To those of you reading this who may be new to Data Analytics, we are sending you loads of hugs. It's not as easy as you thought (you may be thinking) but keep at it. We are not yet experts in the field but one thing we have been able to understand is, the road never really gets smoother, there will always be bumps and curves that will pose as challenges. you learn one thing today and it helps you solve a problem completely, tomorrow, that thing you learnt may only solve 10% of another problem. Keep growing, keep working on projects, get into communities, supportive ones and finally rest when you need to.
Link to the Power Bi File: app.powerbi.com/links/5EqoNlO48k?ctid=1bb30..
Remember: Suicide should never be an option, seek help if you need to please.
DataloverZ! We Out!!

